
Chat costs vs. run costs
Your costs come from two places, and they behave differently:- Chat costs — what you spend talking to Dataleap while building and refining an agent. High chat costs at the start are normal: that’s the building phase. Once the agent is finished, they drop to zero.
- Run costs — what each execution consumes. This is the recurring cost, and it’s where the optimization levers below apply.
Budgets (admin)
The Budgets page in the admin panel shows the monthly org spend for the billing period — and sets the caps:- Weekly member budgets — hard weekly caps per person, resolved in order: user-specific budget → team budget → org default. The most specific one wins.
- Weekly team-agent budgets — a hard weekly budget shared across every team agent on a team, with an org default as fallback.
- Monthly org budgets (token and Dataleap usage) are monitoring views — passing them doesn’t block runs or stop agents; the weekly caps are the hard limits.
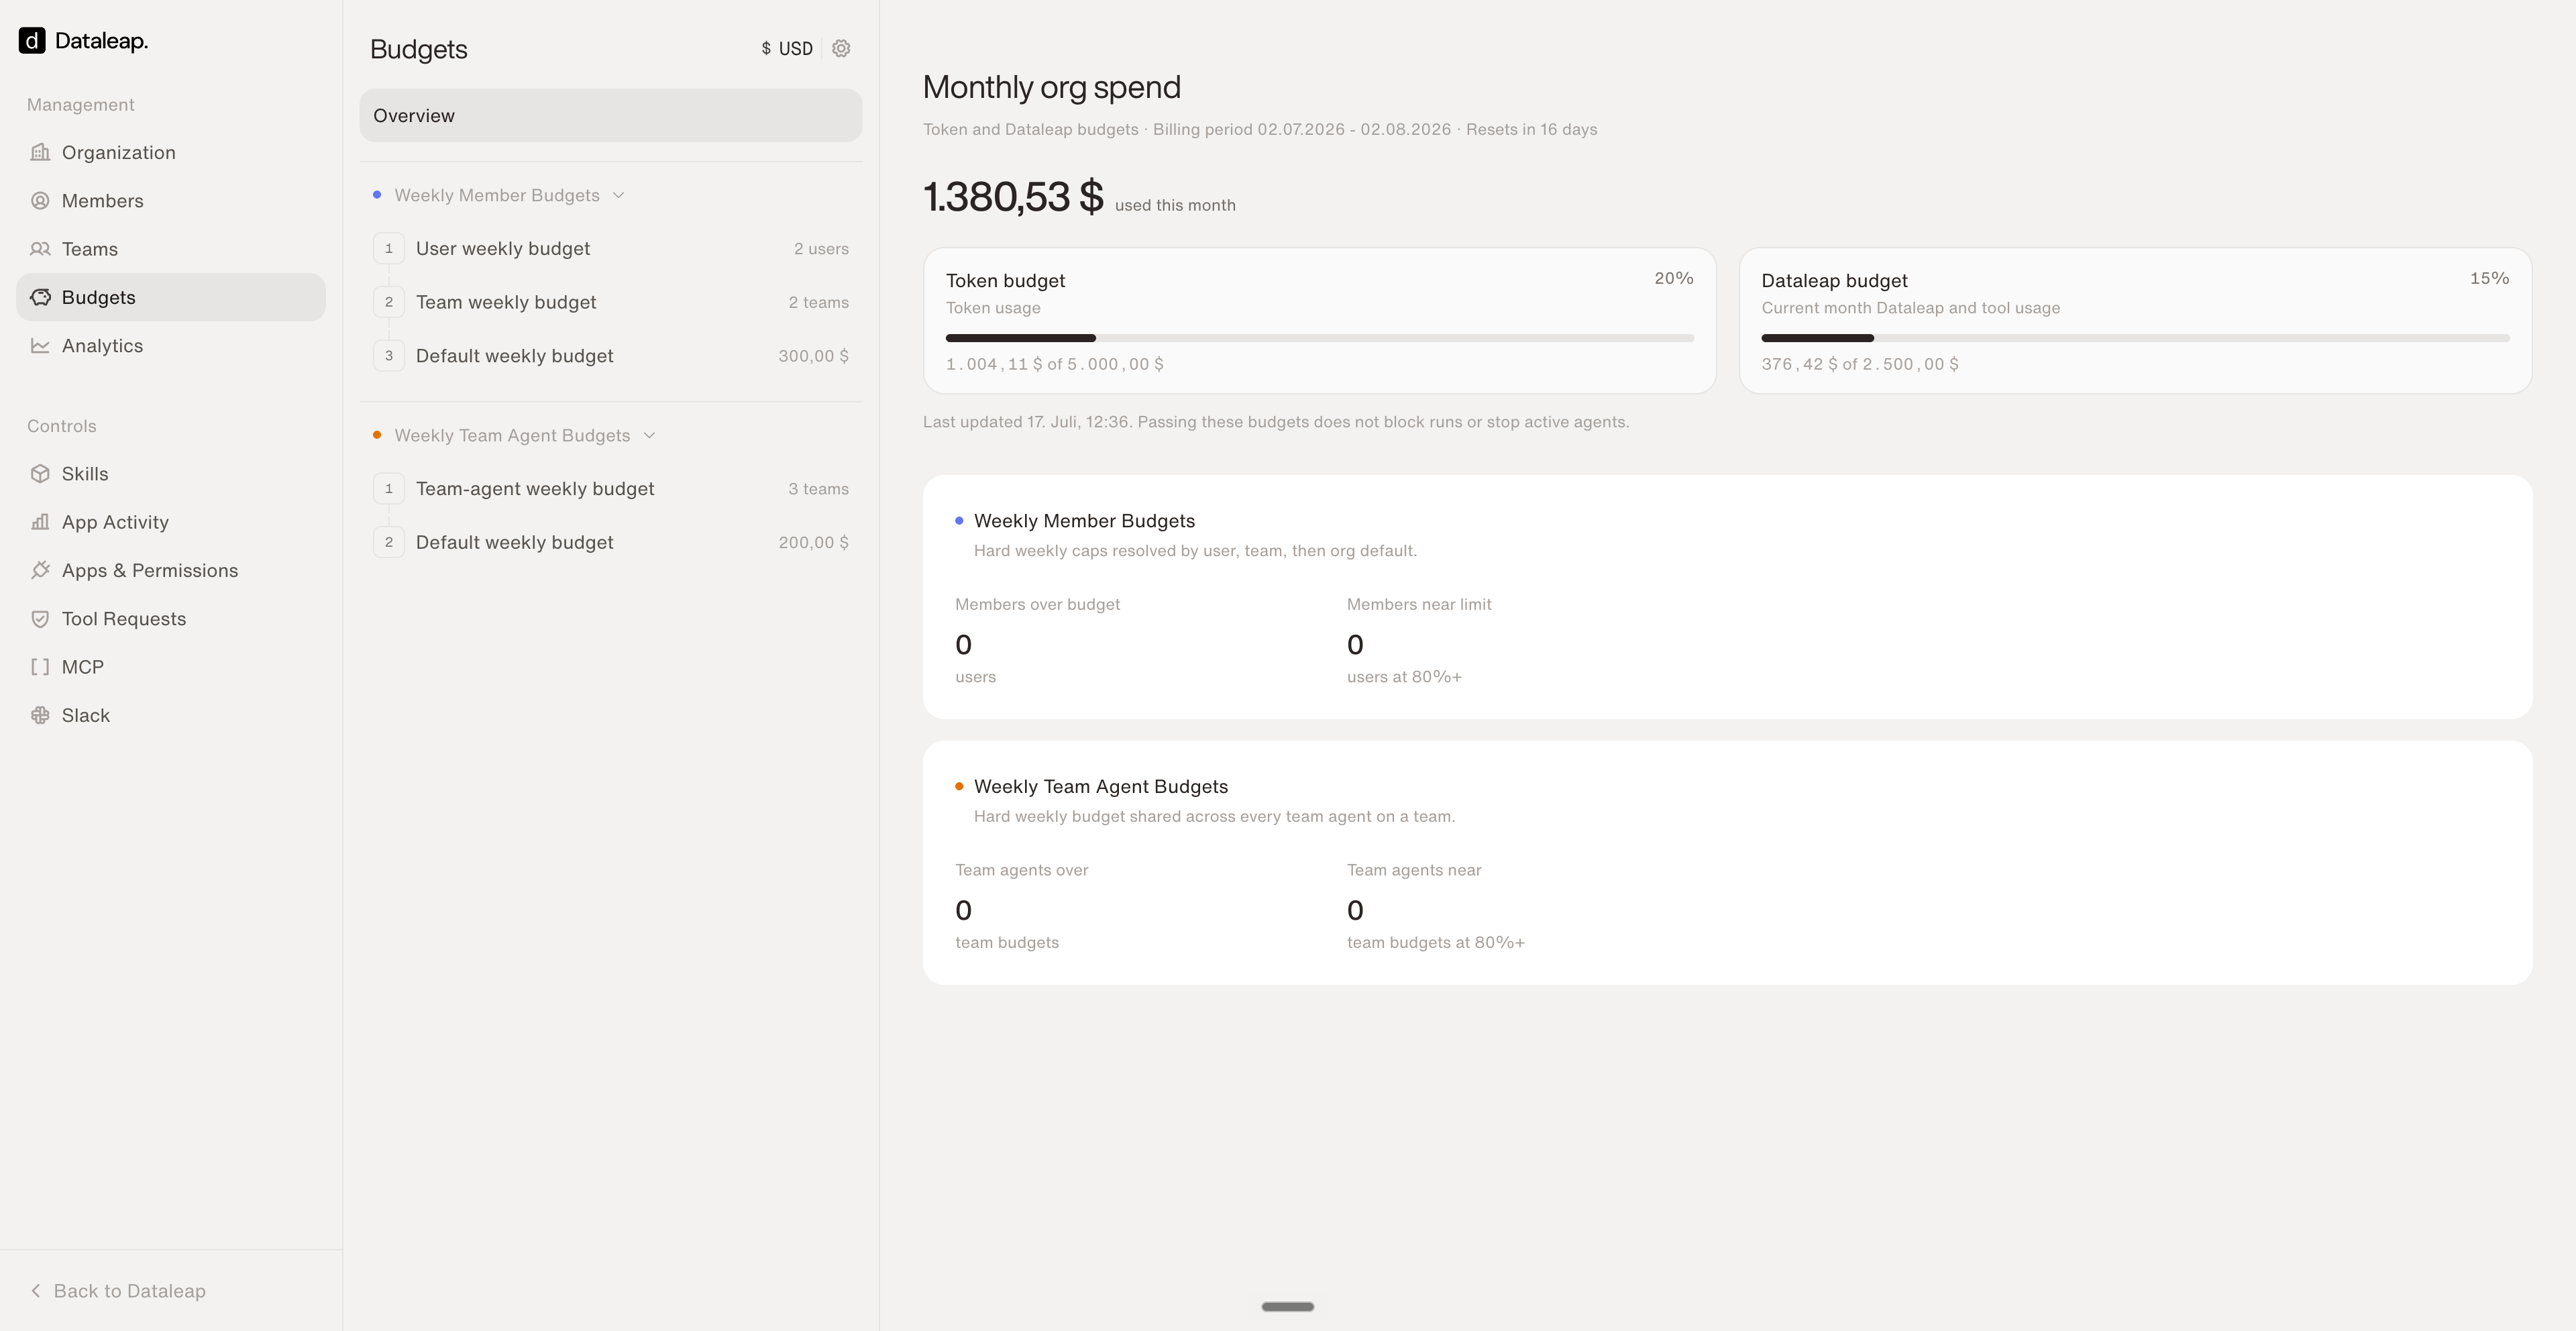
Budgets: monthly org spend on top, hard weekly caps for members and team agents below.
Analytics (admin)
The Analytics page answers “what’s actually happening”:- Overview — users, agents, active agents, weekly active users, and the billing period’s cost split (token, Dataleap, and tool usage).
- Adoption — how agent count and weekly active users develop over time.
- Per-agent list — every agent with its owner (person or team), active status, cost breakdown, and run count. Expand any agent for an AI-generated summary of what it does — no more guessing what “New Workflow” is.
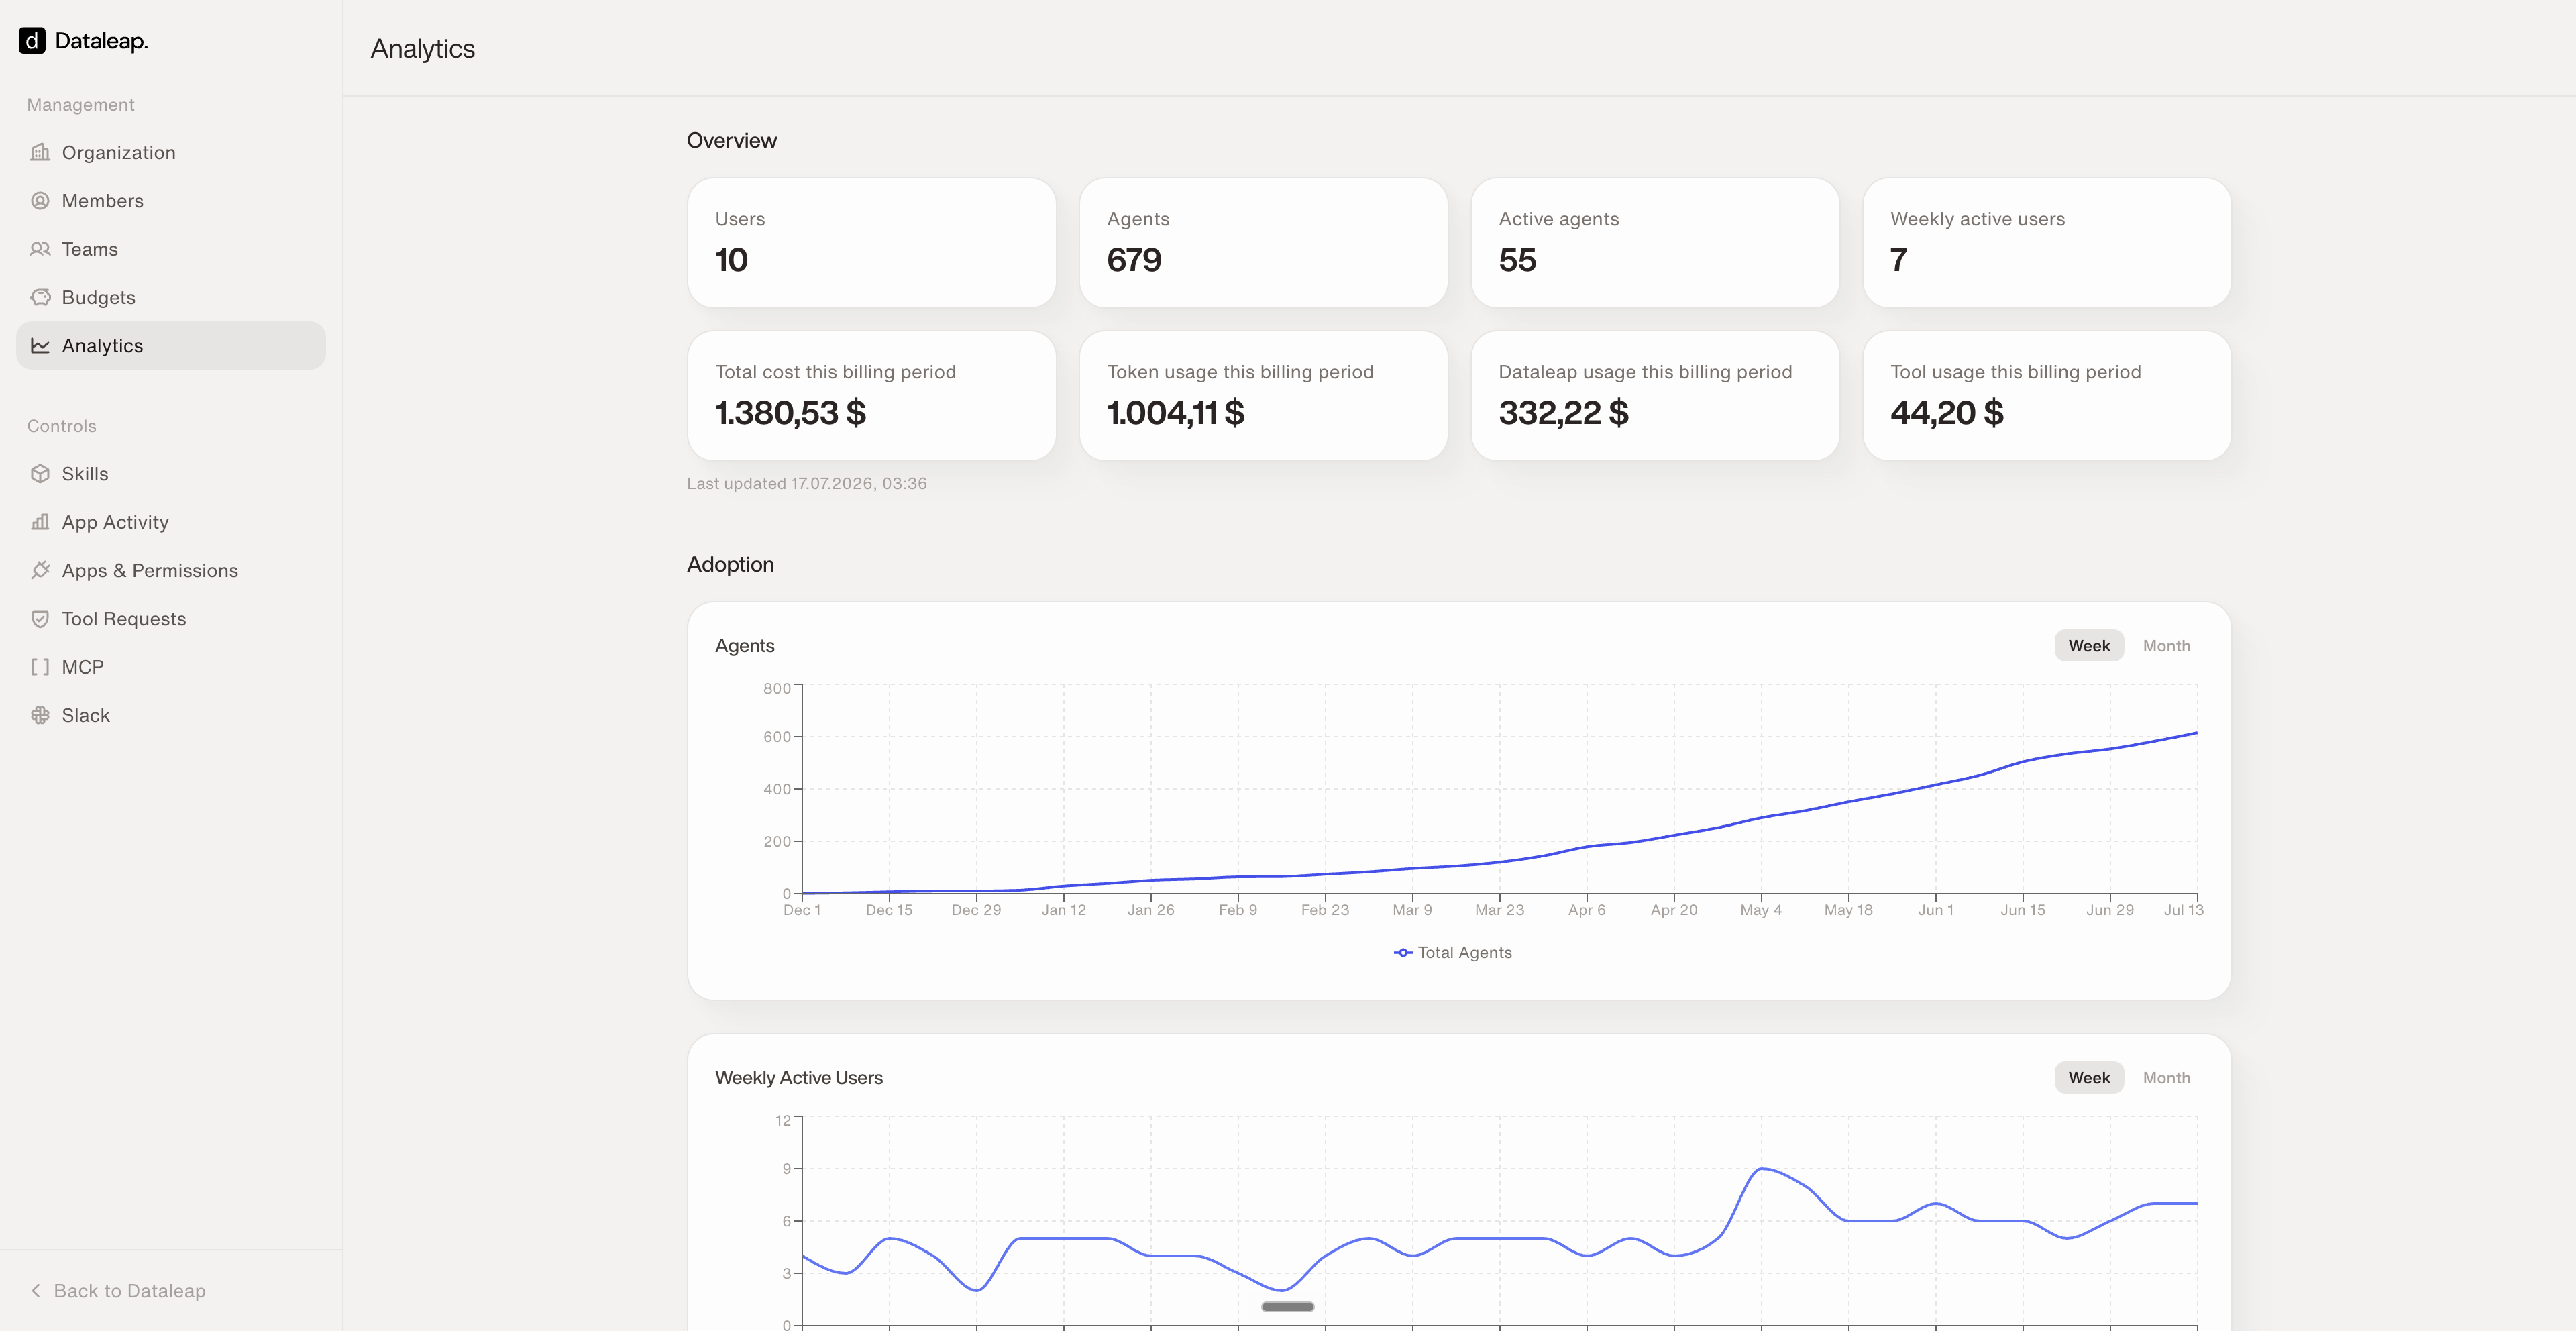
Analytics overview: adoption and spend for the whole workspace.
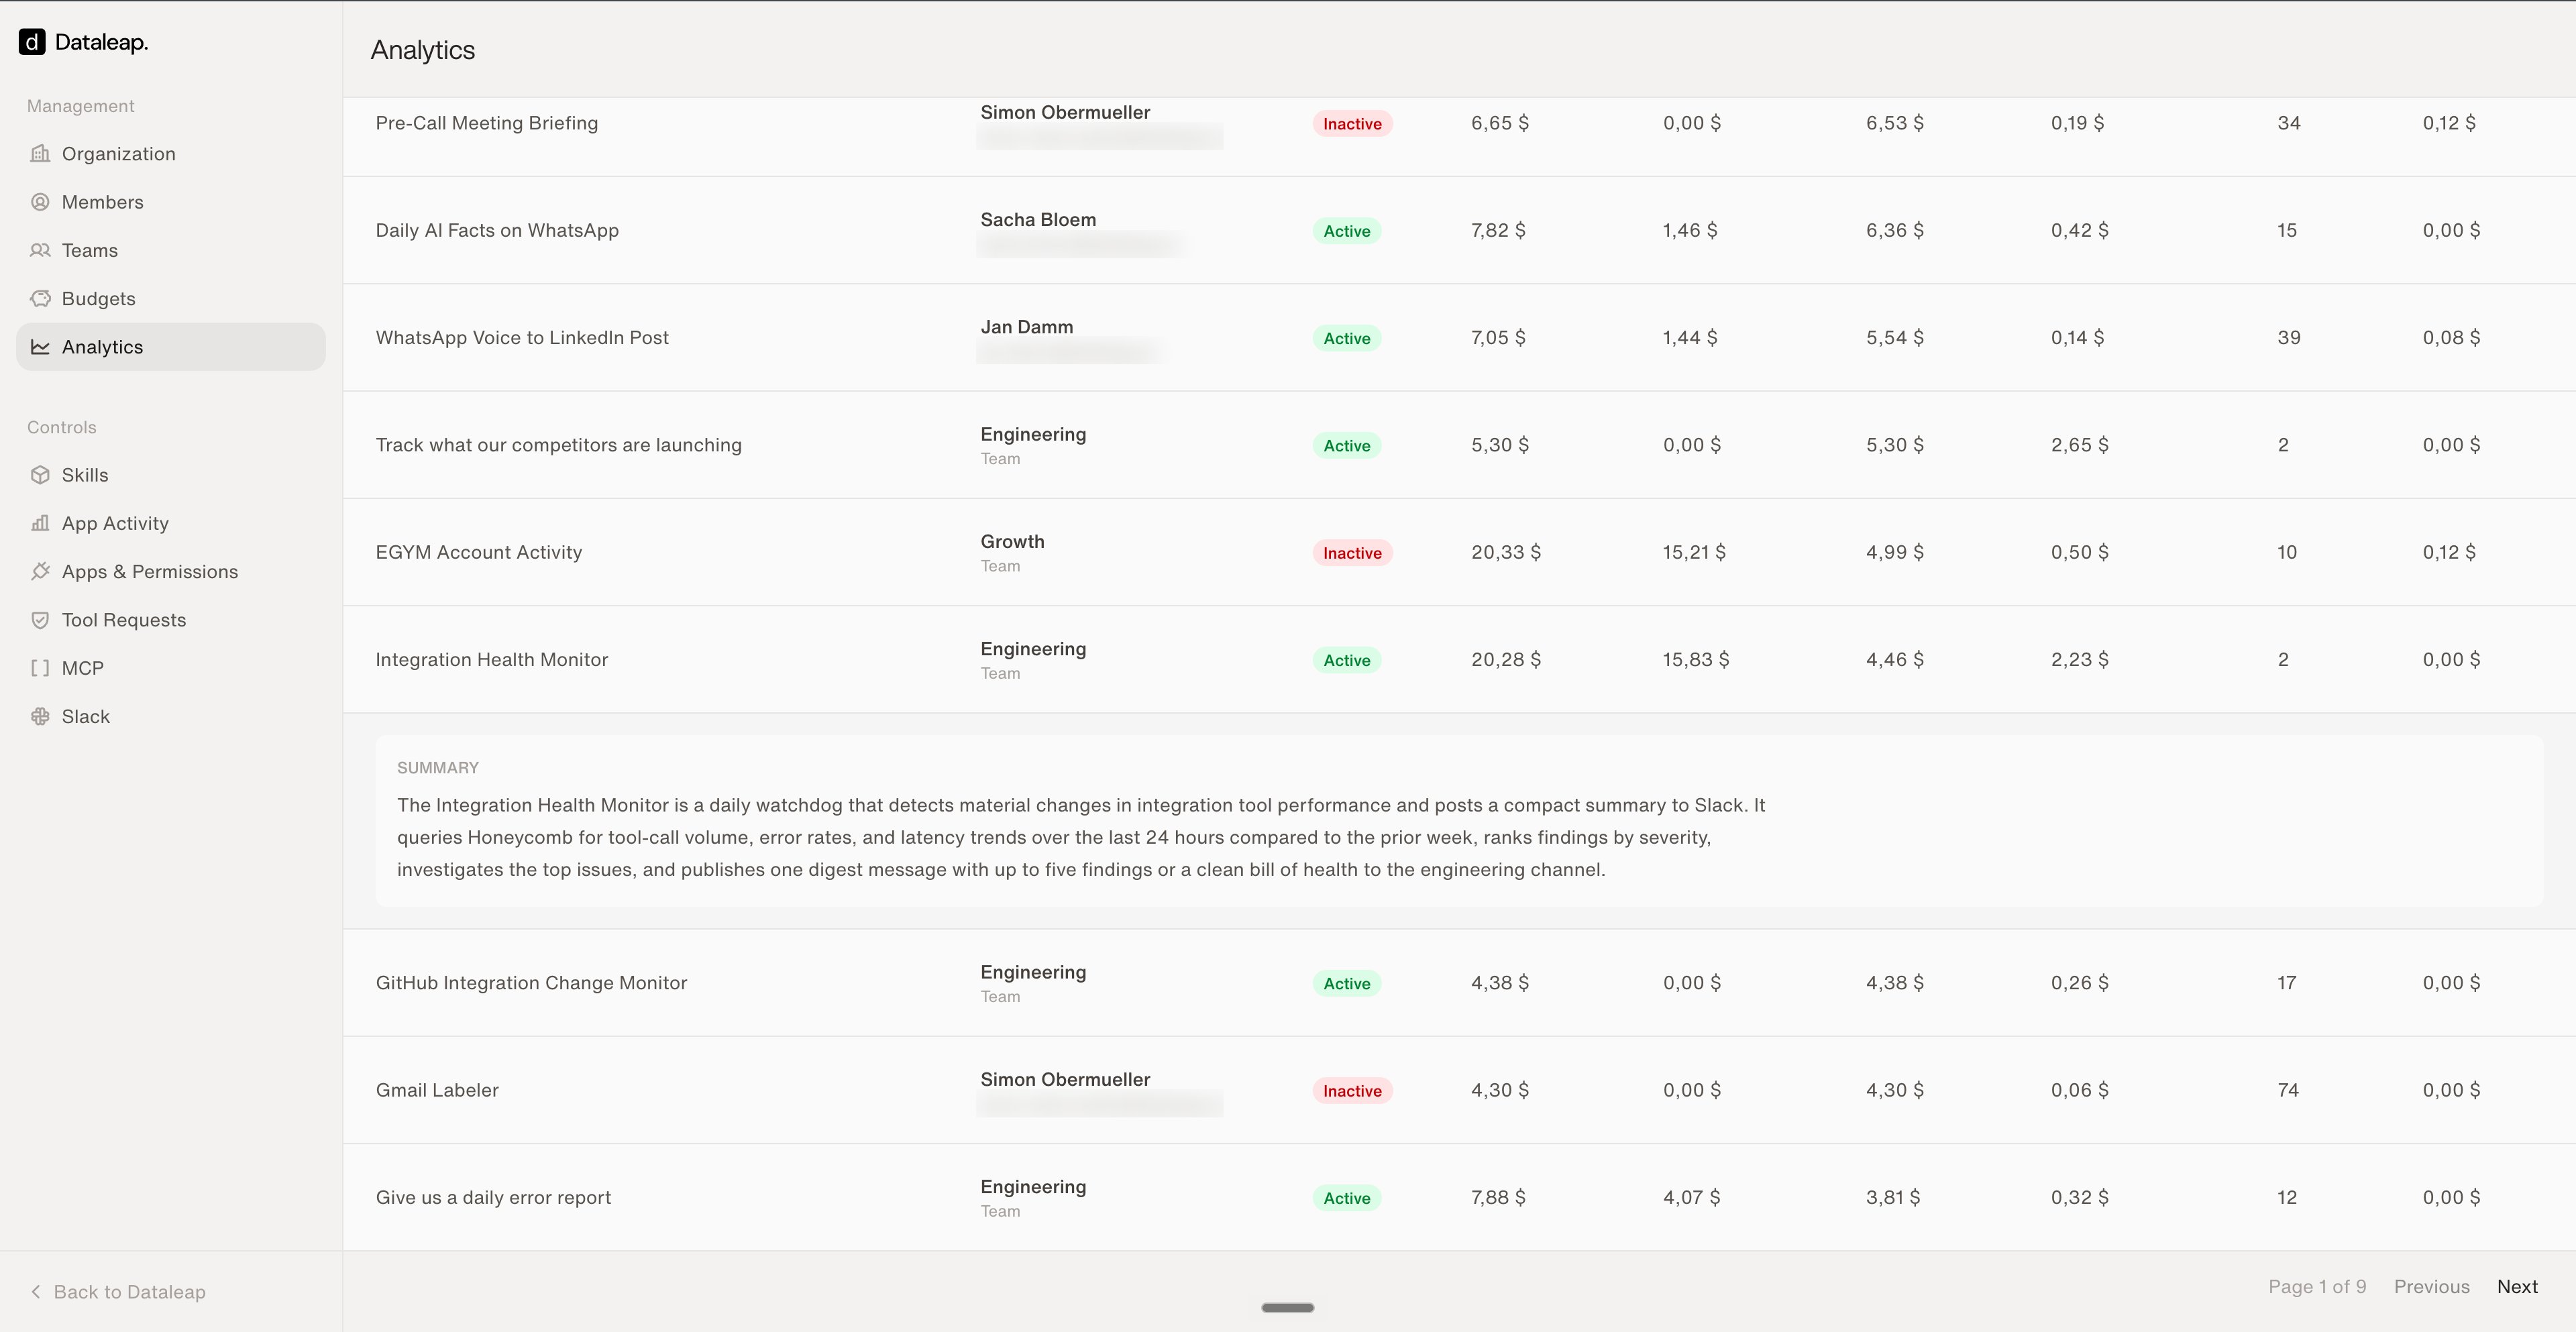
Every agent with owner, status, cost, runs — and an AI summary of what it does.
Your own usage
Outside the admin panel, everyone sees their own picture: Usage in the sidebar shows your weekly credit usage and which agents consume it, and each agent’s Runs panel lists every execution with status, output, duration, and cost.Reduce the spend: the levers that matter
Apps & permissions
Next: govern which tools agents can reach.
Triggers
The single biggest spend lever, explained.